Audits: UX, Competitive, and Content
 About the Projects
Why conduct an audit? Because innovation requires us to advance from a current state to a better future state. Without having a solid understanding of the current state, you base your innovation efforts on bias, opinion, and happenstance.
UX Audits
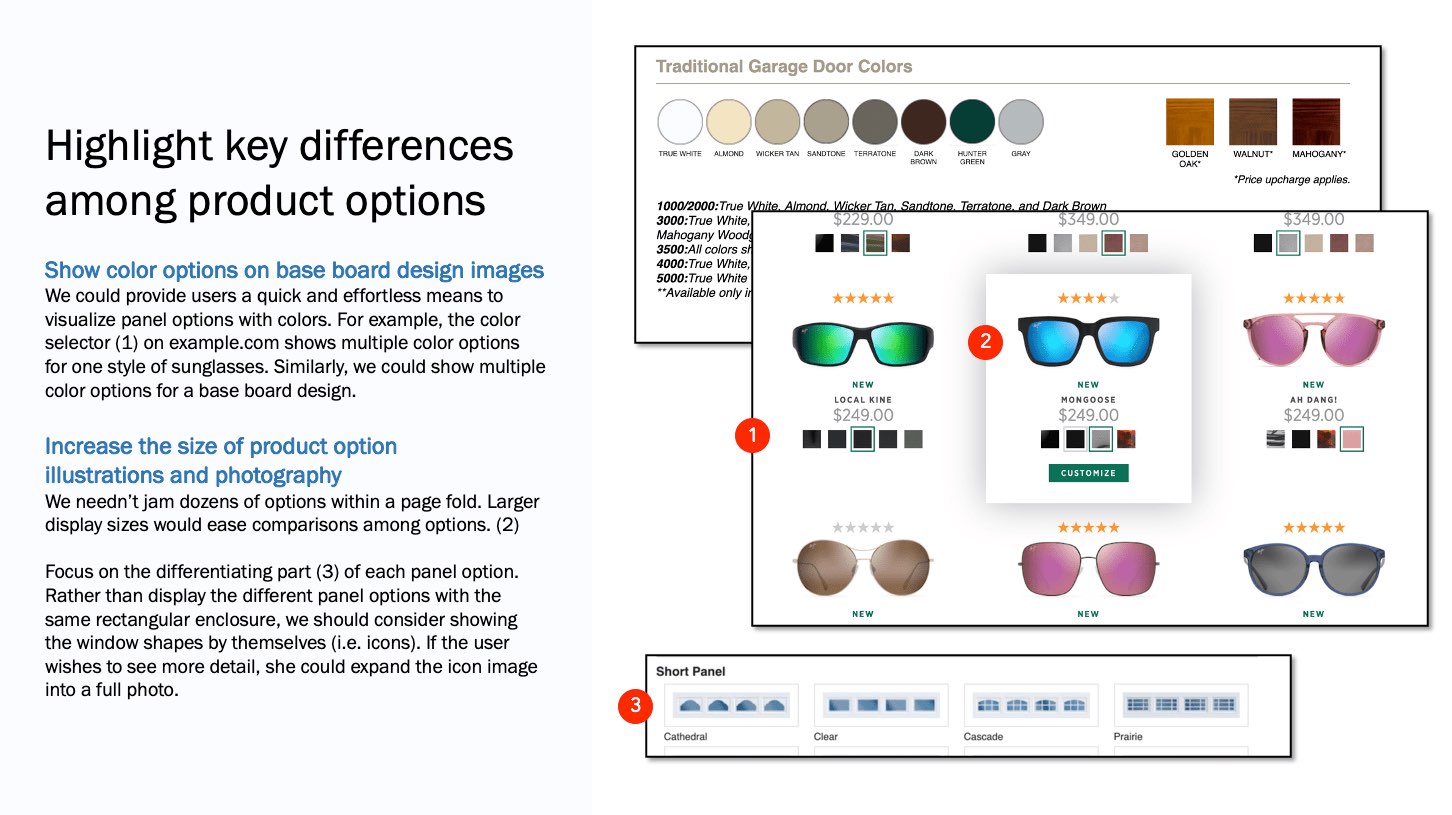
An effective audit tells you what works and what does not within an experience. Audits begin to lay the groundwork for modernized design, content, and development. They uncover common design, labeling, and usability issues. We judge each interface element according to established principles, such as Nielsen's Usability Heuristics for User Interface Design and Tognazzini's First Principles. An accompanying heuristic analysis scores issues in terms of severity. The scoring helps the team prioritize addressable issues. Additionally, UX audits complement mixed-methods research, bolstering both qualitative and quantitative findings by providing potential explanations of observed phenomena.
Slide from a UX audit ( View image )
Competitive & Comparative Audits
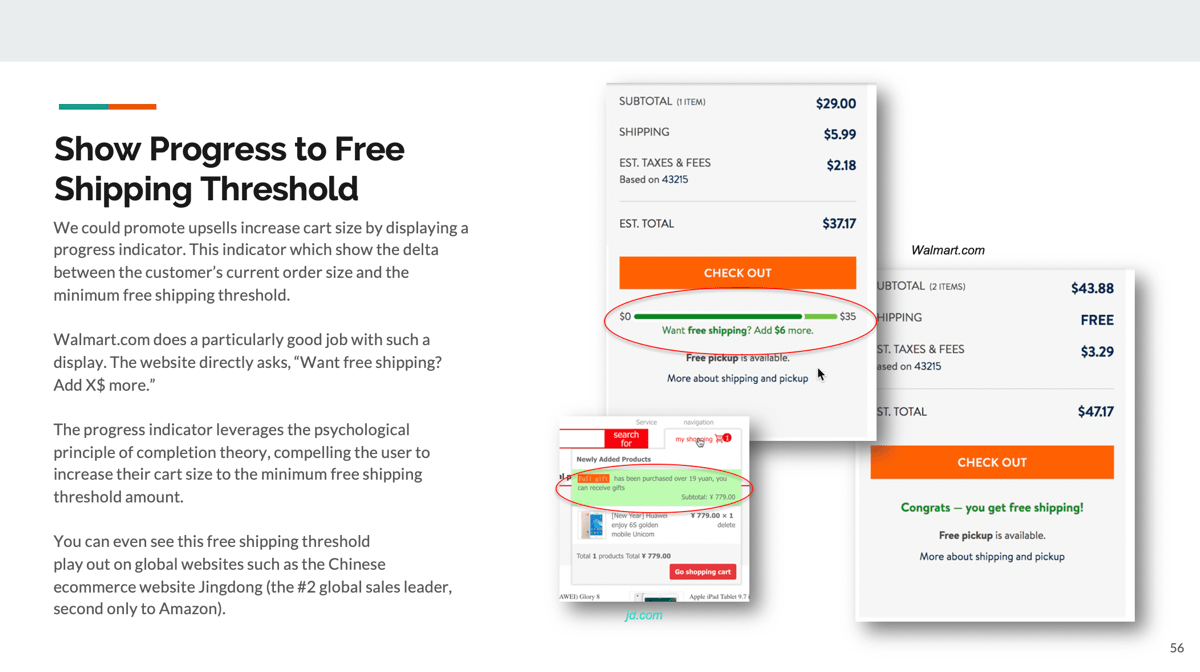
When evaluating a website or app, we strive to identify the relative strengths and weaknesses of competitive and comparative experiences. We discover opportunities for success, establish benchmarks, and uncover trends. Criteria may include: highlights and lowlights, novel conventions; and strengths, weaknesses, opportunities, and threats (SWOT) analysis.
Slide from a comparative audit ( View image )
Content Audits
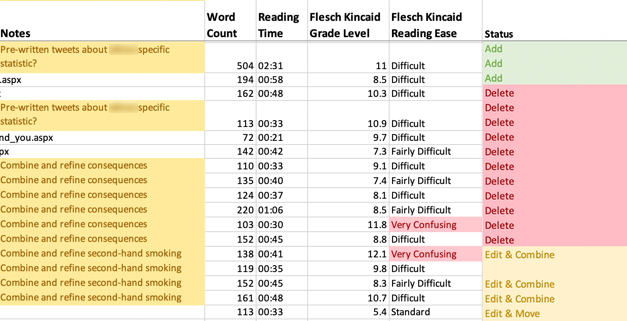
Content audits comprise a listing and analysis of website or app content (e.g. screens, PDFs, videos). The audit enables us to identify needs of new, revised and deleted content. Additionally, the audit may analyze brand tone, voice, and positioning.
Portion of content audit ( View image )
Prioritization of Findings
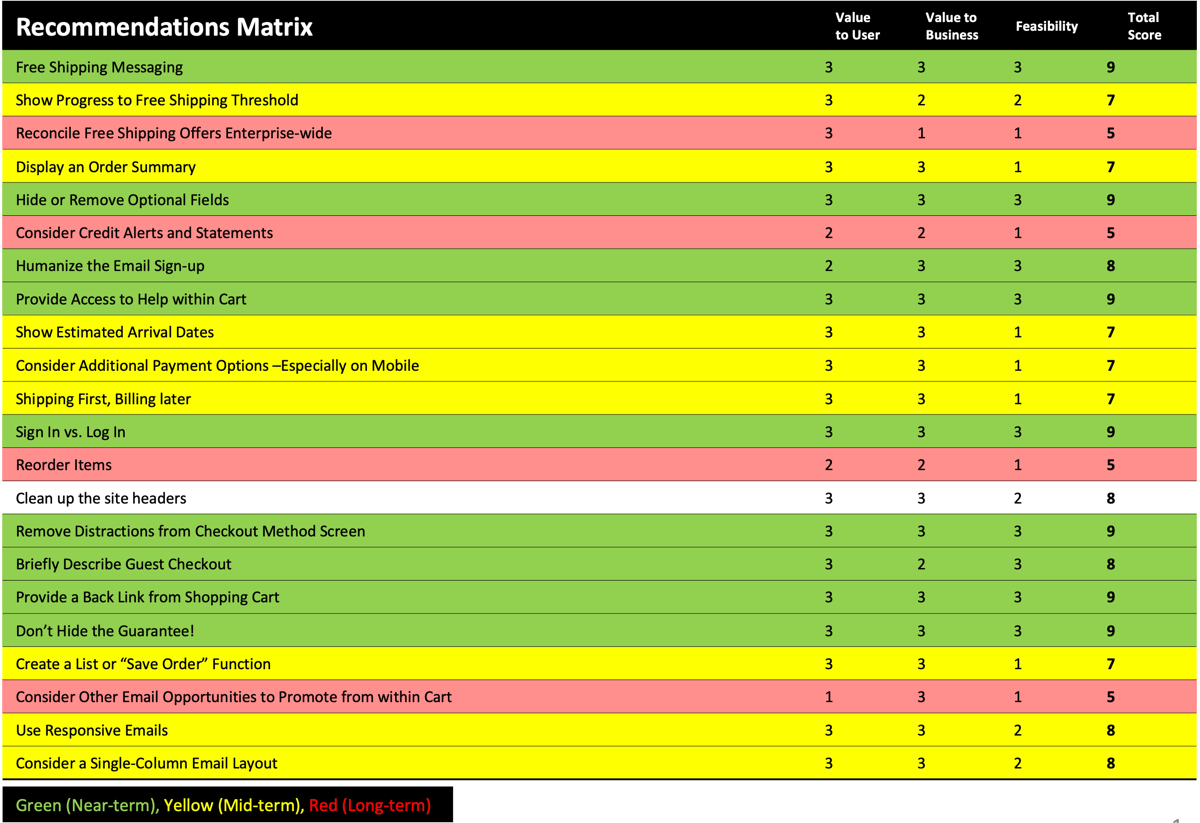
After completion of an audit, prioritization matrices and Kano models help align internal teams around common goals. A matrix lists issues or features, along with a respective scoring for business value, user value, and feasibility. The Kano model (below) shows the relationship between user satisfaction and the business effort needed to achieve it.
Portion of a prioritization matrix ( View image )
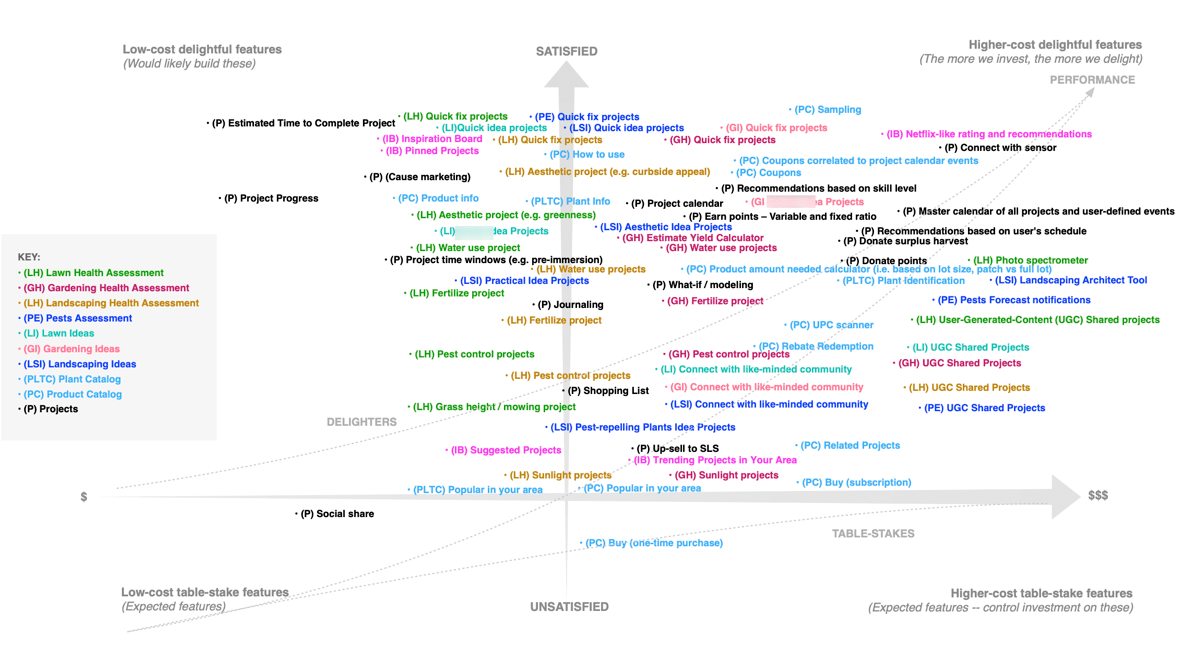 Example of a Kano model for an app project ( View image )