Deloitte helped Walmart reduce downtime and improve efficiency by designing a unified, real-time enterprise asset platform.
 About the Project
Deloitte is a global professional services company with offices in over 150 countries. They wanted to empower Walmart with a leading edge solution that encompassed all aspects of logistics, from event processing to business workflows and process automation.
Key Impacts
Unified Asset Data
The Asset Intelligence app unifies physical and digital asset data into a single interface for all employees, managing the massive scale of over 80,000 unique SKUs tracked across regional distribution and e-commerce fulfillment centers.

Real-Time Analytics
Real-time analytics shift focus from data gathering to problem-solving by tracking equipment conditions—such as temperature and performance—across a regional distribution center's 12 miles of moving conveyor belts.

Simplified Navigation
Asset navigation became standardized and intuitive. Consolidating multiple data sources into single views significantly improved accessibility for all users.
Proactive Maintenance
Leveraging real-time machine data for proactive maintenance helps frontline operators reduce reactive events across Walmart's massive portfolio of over $136 billion in global property and equipment assets.
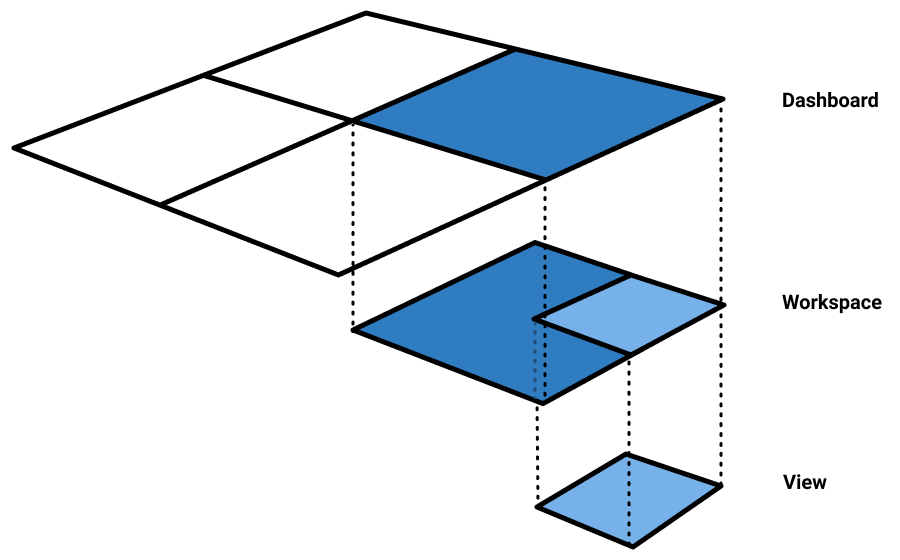
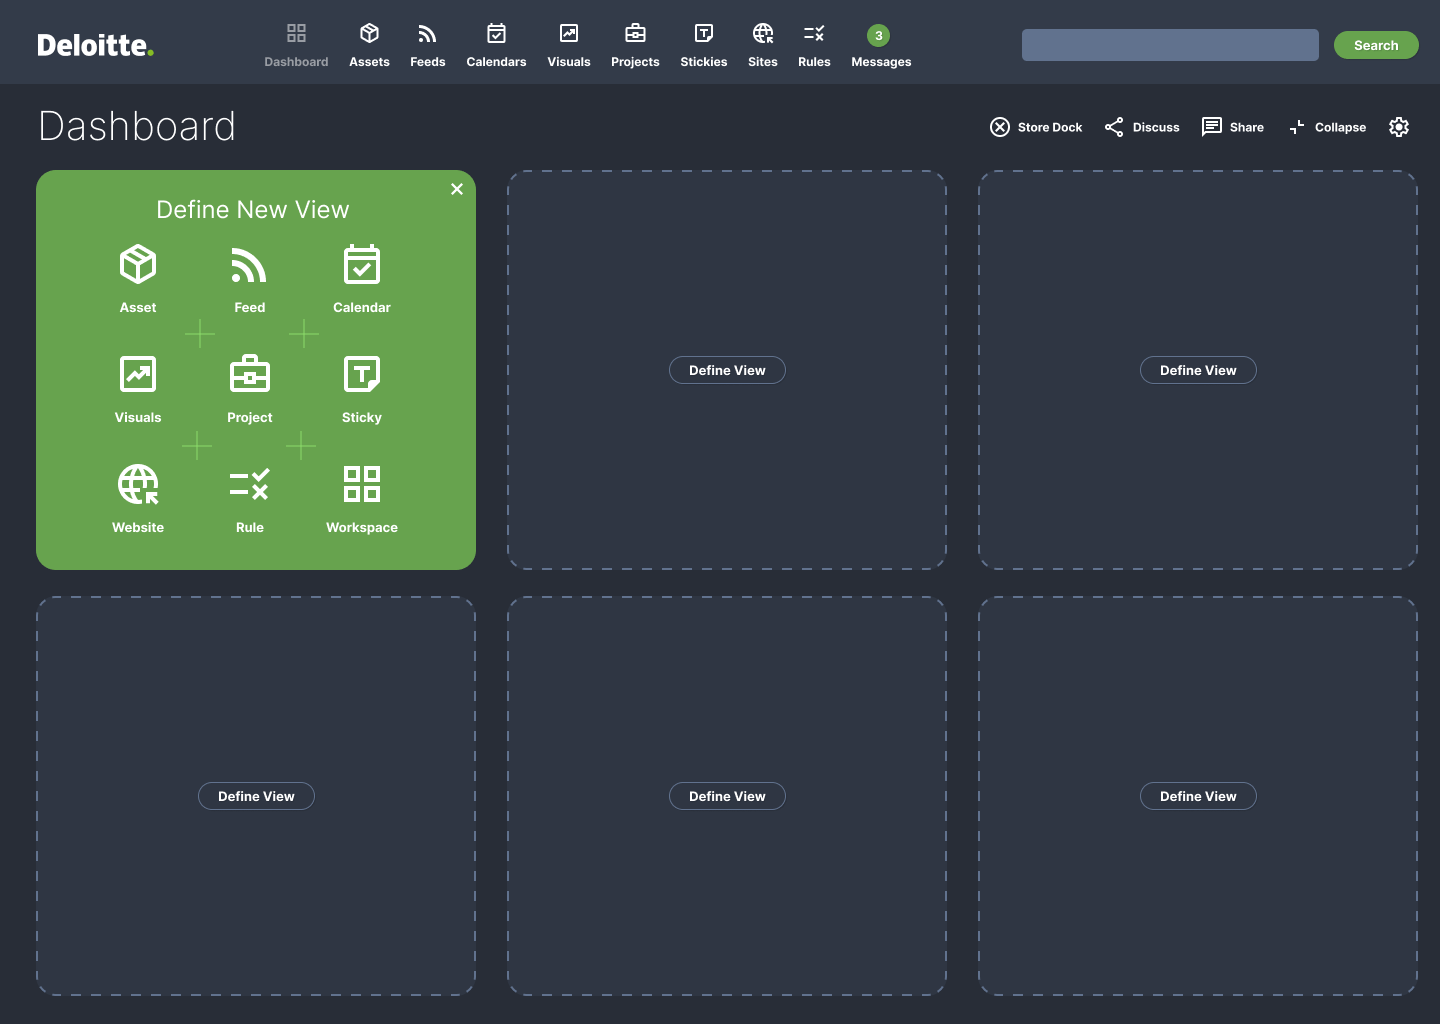 Users built views based on their context of use – from a simple sticky to a complex bundle of signal data
Multiple contexts
Companies maintain physical and digital assets (e.g. warehouses, machines, databases) that send, receive, and store information throughout an enterprise. The Asset Intelligence application was designed to consolidate all of those data sources into a single, nimble, and flexible user interface.
more
Because a user’s background varied widely – from frontline operator through c-suite executive – the application’s functionality had to conform to multiple scenarios. The depth and breadth of functionality crossed contexts of use. For example, a machine operator may want to know specific details about a single machine, whereas an executive may want to understand performance across an entire category of global machine assets.
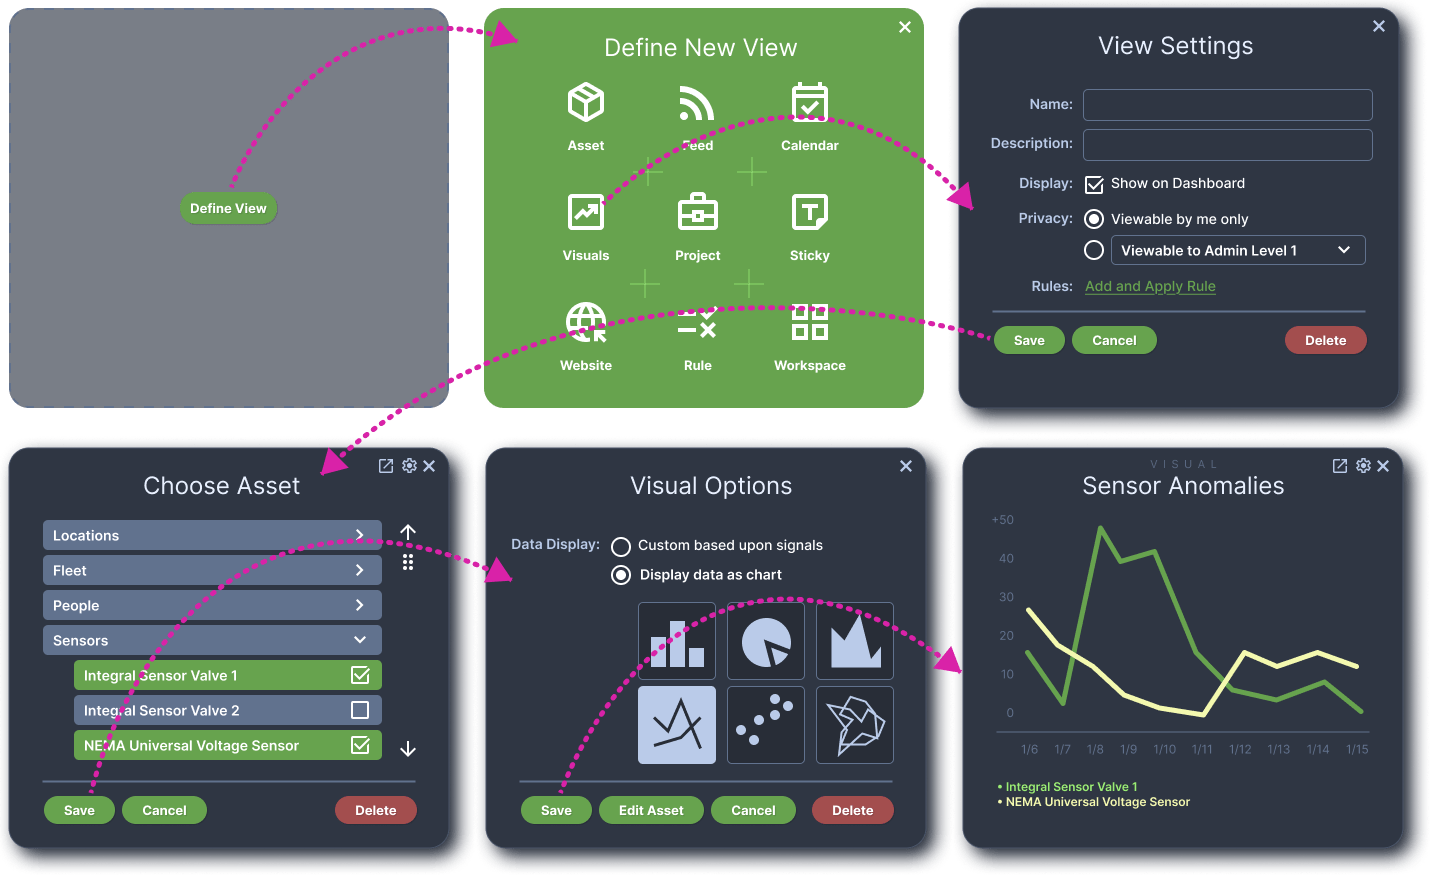
Resolution over collection
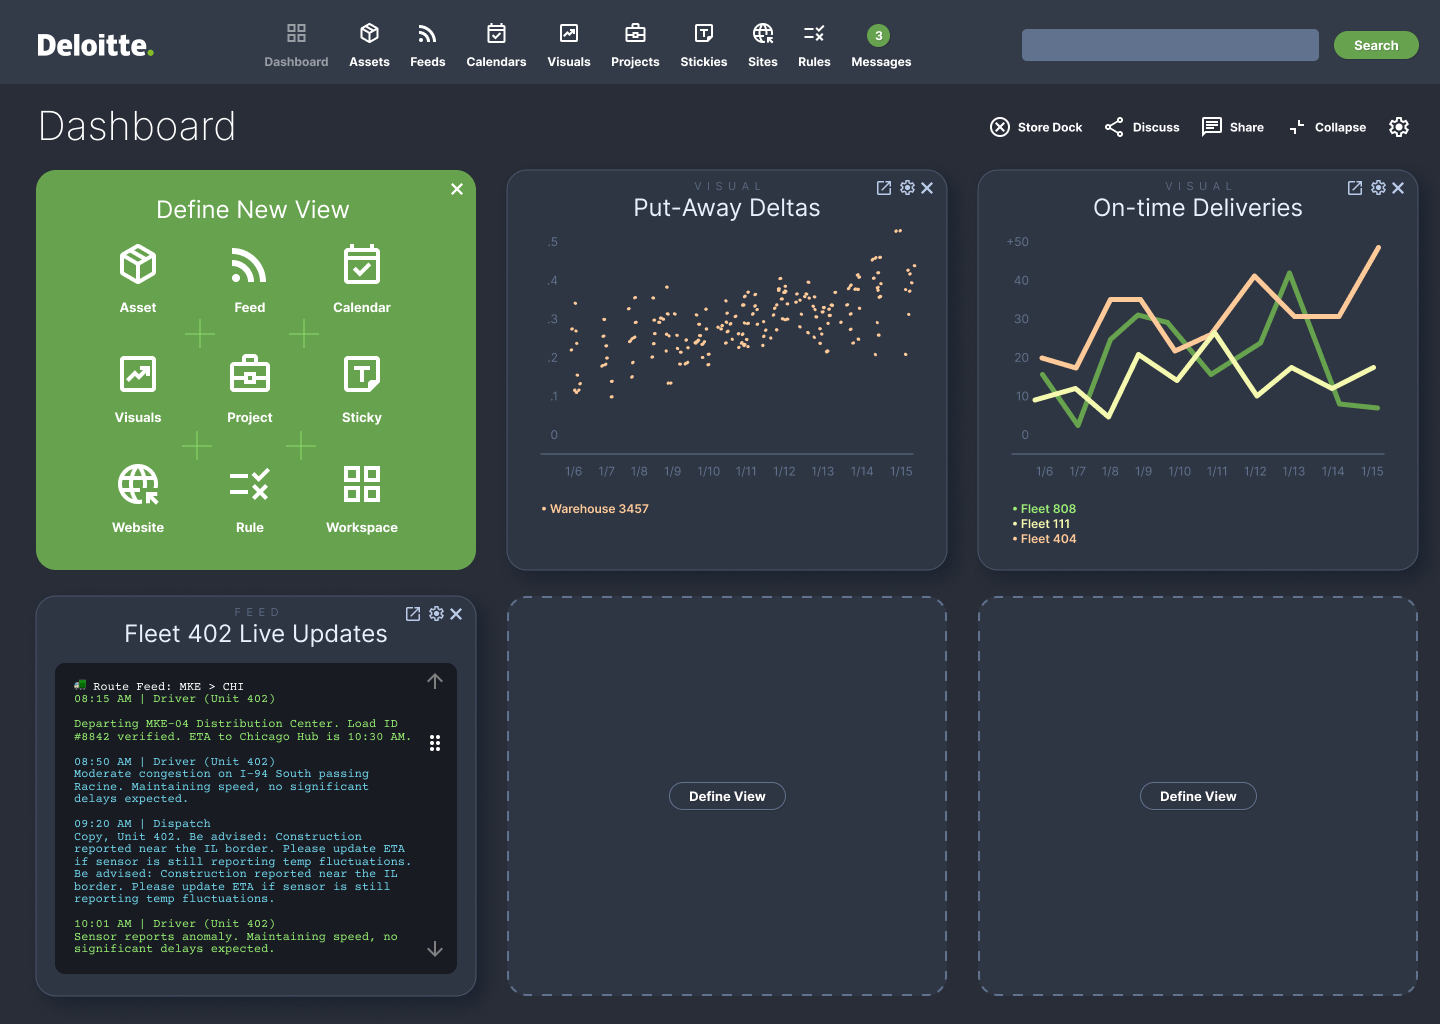
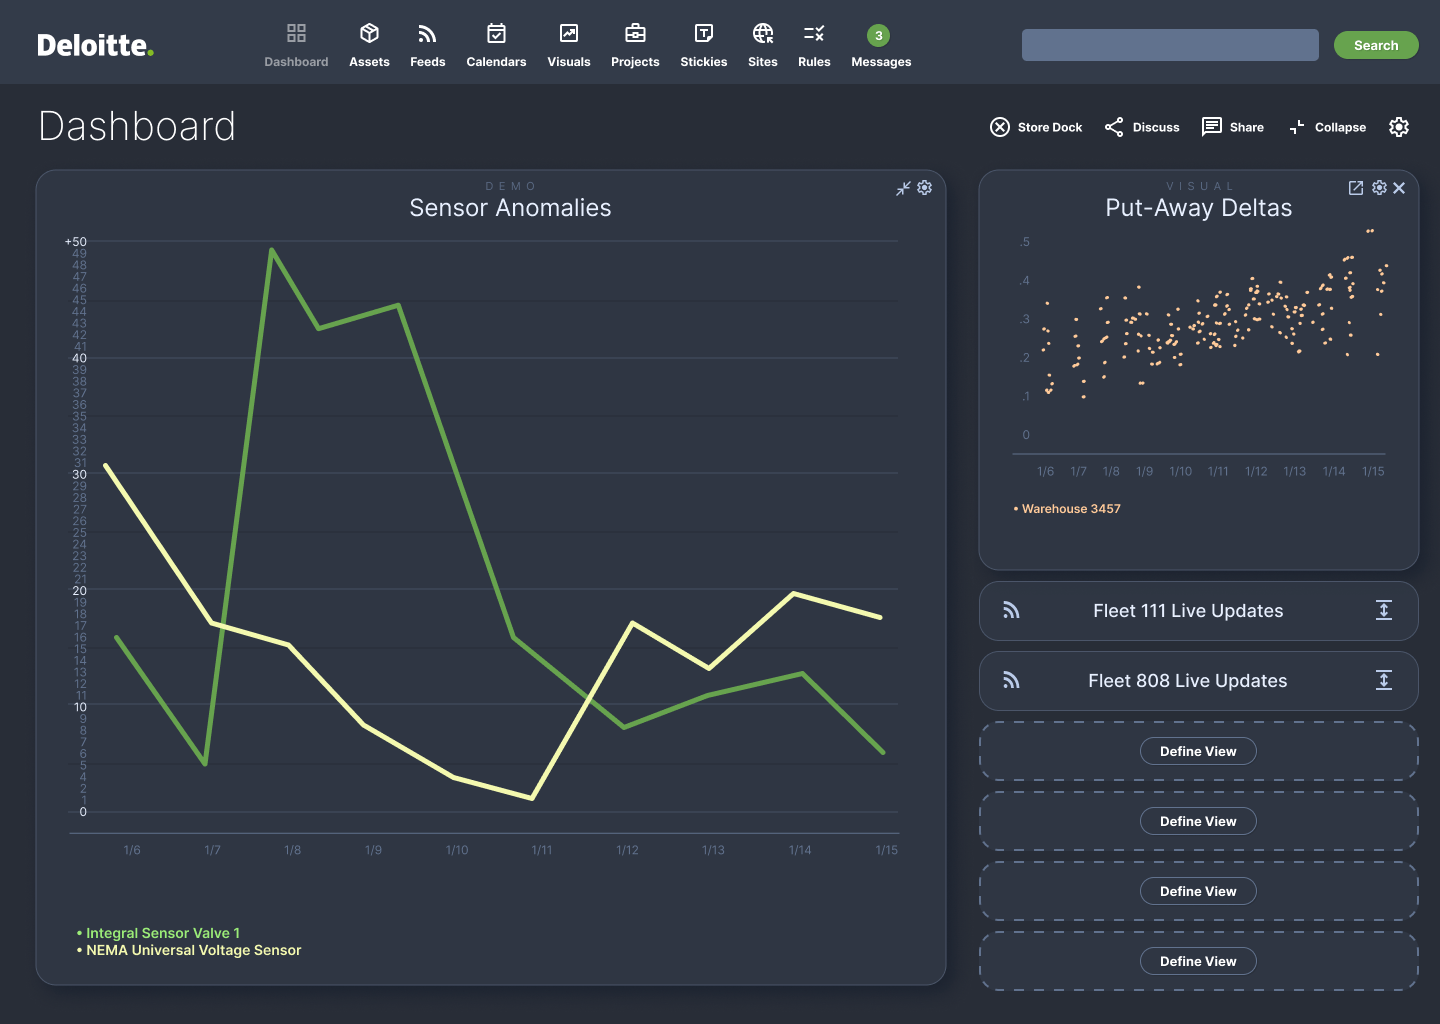
The application’s analytic capabilities enabled users to spend less time gathering data and more time resolving asset-related challenges. Navigation of assets was simple, intuitive, and standardized. As data would be stored across various locations throughout an enterprise, the application had to consolidate multiple data sources in single views (i.e. screens) to improve accessibility and use of data. Some elements were displayed in near real-time, such as an asset’s operating condition (e.g. temperature, performance, wear).
"...spend less time gathering data and more time resolving asset-related challenges."
 Impact
- Unified Asset Data: The Asset Intelligence app consolidated physical and digital asset data into a single interface, serving everyone from frontline operators to executives.
- Real-Time Analytics: Analytics shifted user focus from gathering data to solving problems. Near real-time displays actively tracked equipment conditions like temperature, wear, and performance.
- Simplified Navigation: Asset navigation became standardized and intuitive. Consolidating multiple data sources into single views significantly improved accessibility for all users.
- Proactive Maintenance: Real-time machine data allowed frontline operators to catch anomalies early, which directly reduced reactive maintenance events.
- Reduced Tool Fatigue: A unified interface for global enterprise assets lowered the training burden and eliminated the need to navigate multiple separate tools.
- Enhanced Executive Insights: Providing category-wide performance views of global assets helped executives improve their capital planning and asset utilization decisions.
- Massive Cost Reductions: At a massive scale, even marginal warehouse efficiency improvements significantly reduced logistics downtime and generated substantial financial savings.
- Scalable Consulting Product: The replicable platform created a highly scalable product that could be deployed across other large retail or logistics clients.
- Predictive Foundations: Near real-time signals and business rules established a foundation for future machine learning models to anticipate equipment failures before they occur.
more
Other Notable Projects
- Research, synthesis, and workshops for a global cooperative and clients of its flagship product
- Product design and research for an ML-based (machine learning) insect identification app
- Service design for a national bank's collections procedures